Accelerate Your Python For-Loops

And profile speed and memory usage in Python.
You’ve probably stared at a for loop that takes ages to finish and thought: “Come on Python, you can do better.” And you’re right — Python can do better. But not without a little help from you.
In this article, I’ll walk you through how to squeeze performance out of your for loops — starting with parallelization using multiple CPU cores and moving toward generators for memory-efficient iteration. We’ll end by poking into the black box of performance bottlenecks with some profiling tools.
So if you're a Pythonista who's ever waited too long for a script to finish, this is for you.
Part 1: From Slow Loops to Speedy CPUs
Let’s start with a problem. Say you have a list of numbers and want to apply a heavy function to each one:
import time

def heavy(x):
    time.sleep(0.5)  # Simulate a heavy computation
    return x * x

nums = list(range(10))
results = [heavy(x) for x in nums]
This runs in… 5 seconds. You deserve better.
The fix: multiprocessing with map, starmap, and joblib
Step 1: Use Python’s multiprocessing.Pool
from multiprocessing import Pool

with Pool() as pool:
    results = pool.map(heavy, nums)
That’s it. It’ll use as many cores as your CPU allows by default.
In the MacBook, you need this as a script.
from multiprocessing import Pool
import time

def heavy(x):
    time.sleep(0.5)
    return x * x

def main():
    nums = list(range(10))
    with Pool() as pool:
        results = pool.map(heavy, nums)
    print(results)

if __name__ == "__main__":
    main()
Save it as e.g. test.py . Then run python test.py.
Now it runs in ~0.5 seconds (give or take some overhead) and returns:
[0, 1, 4, 9, 16, 25, 36, 49, 64, 81] .
In Jupyter or ipython (in any interactive execution of the code), use joblib instead:
from joblib import Parallel, delayed
import time

def heavy(x):
    time.sleep(0.5)
    return x * x

nums = list(range(10))
results = Parallel(n_jobs=-1)(delayed(heavy)(x) for x in nums)
print(results)
Step 2: When your function takes multiple arguments — use starmap
nano test_parallel_multiple_arguments.py:
from multiprocessing import Pool
import time

def heavy_multi(x, y):
    time.sleep(0.5)
    return x * y

def main():
    xy = [(x, x+1) for x in range(10)]

    with Pool() as pool:
        results = pool.starmap(heavy_multi, xy)
    print results

if __name__ == "__main__":
    main()
python test_parallel_multiple_arguments.py - output:
[0, 2, 6, 12, 20, 30, 42, 56, 72, 90].
Step 3: For serious control, use joblib’s Parallel
from joblib import Parallel, delayed

def heavy_multi(x, y):
    time.sleep(0.5)
    return x * y

nums = list(range(10))

results = Parallel(n_jobs=-1)(delayed(heavy)(x) for x in nums)
Joblib gives you a lot of flexibility: you can load-balance large lists, track progress, and cache results.
To convert your Pool().starmap() example to use joblib, you’ll want to:
- Use
joblib.Parallelfor parallel execution. - Use
joblib.delayedto pass multiple arguments. - Replace
starmapwith unpacking inside the function call.
from joblib import Parallel, delayed
import time

def heavy_multi(x, y):
    time.sleep(0.5)
    return x * y

def main():
    xy = [(x, x + 1) for x in range(10)]

    results = Parallel(n_jobs=-1)(
        delayed(heavy_multi)(x, y) for x, y in xy
    )

    print(results)

if __name__ == "__main__":
main()- n_jobs=-1: use all available CPU cores.
- delayed(heavy_multi)(x, y): wraps the function call for parallel evaluation.
- for x, y in xy: handles the starmap-style unpacking.
And in a REPL:
from joblib import Parallel, delayed
import time

def heavy_multi(x, y):
    time.sleep(0.5)
    return x * y

xy = [(x, x + 1) for x in range(10)]

results = Parallel(n_jobs=-1)(
    delayed(heavy_multi)(x, y) for x, y in xy
)

results   ## Out[1]: [0, 2, 6, 12, 20, 30, 42, 56, 72, 90]
Part 2: Make your loops use less memory and stop crashing your laptop
You’ve parallelized your loops. Your CPU fan is no longer wheezing like it’s trying to launch a rocket. Great. But now your script crashes because it tries to hold 10 million items in memory.
We’ll learn in this part how to reduce memory usage with generators, to make our loops more lightweight, avoid creating giant intermediate lists, and even see the memory footprint of a code piece with proper tools.
Let’s make your code lean and elegant like a ninja, not a sumo wrestler.
1. When Lists Become the Problem
Let’s start with something innocent-looking:
nums = list(range(10_000))
squares = [x * x for x in nums]
Sure, it works — if you’ve got enough RAM to rival a data center. But if you’re on a modest laptop? You might watch your system freeze and swap like it’s 1995.
What’s the problem? That [] comprehension builds all ten million results in memory before doing anything with them.
Let’s fix that.
2. Generator Expressions: The Lazy Alternative
Just change [] to ():
nums = range(10_000)
squares = (x * x for x in nums)
Now nothing happens until you ask for it.
for val in squares:
    if val > 1_000_000_000:
        break
This loop uses a tiny sliver of memory. Only one value exists at a time.
It’s like switching from a buffet to a sushi conveyor belt. One plate at a time. No overload.
3. From return to yield: Writing Your Own Generators
You can make your own generator functions. Instead of returning a whole list:
def compute_all(nums):
    result = []
    for x in nums:
        result.append(x * x)
    return result
You do this:
def compute_all(nums):
    for x in nums:
        yield x * x
Now:
for val in compute_all(range(10_000_000)):
    process(val)
This approach shines when your function feeds into another. You don’t need intermediate results clogging up memory.
4. Composing Generator Pipelines
This is where things get beautiful. Let’s say you’re reading a massive file of numbers (one per line). You want to filter out blanks, strip whitespace, convert to integers, and sum them — without ever loading the file into memory.
Here’s how you do it:
def read_lines(path):
    with open(path) as f:
        for line in f:
            yield line.strip()

def filter_empty(lines):
    return (line for line in lines if line)

def to_ints(lines):
    return (int(line) for line in lines)

lines = read_lines("bigfile.txt")
cleaned = filter_empty(lines)
numbers = to_ints(cleaned)

total = sum(numbers)
Each step is a layer in a generator pipeline. Nothing gets computed until it’s needed. You could process a 100GB file like this with minimal RAM usage.
5. Bonus: yield from for Cleaner Composition
Let’s say you’re calling another generator inside your generator. This:
def nested():
    for x in range(3):
        yield from subgen(x)

def subgen(x):
    yield x
    yield -x
Is cleaner than writing:
for val in subgen(x):
    yield val
yield from delegates, cleanly. It’s the generator equivalent of delegation — without the ceremony.
6. But How Do I Know It Helped? Profiling Memory
Okay. You wrote fancy generator code. But how do you know it helped?
Install this tool:
pip install memory-profilerNow decorate your function - nano test_memory_profile.py:
from memory_profiler import profile

@profile
def compute_with_list():
    nums = list(range(10_000))
    squares = [x * x for x in nums]
    return sum(squares)

if __name__ == "__main__":
    compute_with_list()
Run it like:
python -m memory_profiler test_memory_profile.pyIt’ll print out line-by-line memory usage. You’ll see how much RAM each line allocates. It’s like X-ray vision for Python performance.
Filename: test_memory_profile.py

Line #    Mem usage    Increment  Occurrences   Line Contents
=============================================================
     3     46.9 MiB     46.9 MiB           1   @profile
     4                                         def compute_with_list():
     5     47.1 MiB      0.2 MiB           1       nums = list(range(10_000))
     6     47.5 MiB      0.3 MiB       10003       squares = [x * x for x in nums]
     7     47.5 MiB      0.0 MiB           1       return sum(squares)
Takeaways: When to Use Generators
- Reading files line by line? Use a generator.
- Processing large ranges? Use a generator.
- Don’t need random access? Use a generator.
- Memory-constrained environment? Use a generator.
You give up very little — but gain massive scalability.
Part 3: Find out what’s really slowing down your code (and fix it)
You’ve parallelized your loops. You’ve cleaned up memory usage with generators. And yet… something’s still off. The script still lags. You squint at the code, baffled.
It’s time to stop guessing.
Let’s measure.
In this section, we’ll use Python’s profiling tools to find what’s actually consuming your time and RAM. You’ll learn how to visualize the slow bits, pinpoint the memory hogs, and rewrite only what matters.
Because life’s too short to optimize the wrong line.
1. The First Step: Time It
Start simple. Use time.perf_counter() to time chunks of code.
import time

start = time.perf_counter()
result = sum(x * x for x in range(10_000_000))
end = time.perf_counter()

print(f"Took {end - start:.2f} seconds")
Helpful, but too coarse. Let’s go deeper.
2. Spot the Slow Functions with cProfile
You want a profiler that tells you which functions are slow, how often they’re called, and how much time they consume.
Here’s how:
python -m cProfile -s time your_script.pyThe -s time sorts output by time spent in each function. You’ll get something like:
   ncalls  tottime  percall  cumtime  percall filename:lineno(function)
      100    1.234    0.012    2.345    0.023 your_script.py:10(slow_func)
Now you know where time is going.
Want to visualize this?
pip install snakeviz
python -m cProfile -o output.prof your_script.py
snakeviz output.prof
You’ll get a clickable flame chart in your browser. It’s like tracing the DNA of slowness.
3. Zoom In: Line-by-Line with line_profiler
Want to profile individual lines inside a function? Use line_profiler.
pip install line_profilerAnnotate your function like this in a script - nano test_line_profiler.py:
@profile
def slow_loop():
    total = 0
    for i in range(10_000_000):
        total += i * i
    return total

if __name__ == '__main__':
    slow_loop()
Then run:
kernprof -l -v test_line_profiler.pyYou’ll see exactly which line took how long — not just which function.
The @profile is automatically recognized by kernprof. It is not imported.
Great for tight loops.
@profile is invasive. A non-invasive way to profile would be in the interactive REPL:
from line_profiler import LineProfiler

def slow_function():
    total = 0
    for i in range(10_000_000):
        total += i * i
    return total

# by manually adding the functions to be profiled
lp = LineProfiler()
lp.add_function(slow_function)
lp_wrapper = lp(slow_function)
lp_wrapper()  # runs the function

lp.print_stats()
This gives you the same detailed per-line breakdown — without ever touching @profile.
You can add multiple functions for profiling:
lp.add_function(slow_function)
lp.add_function(another_inner_function)
Or if you want to profile every function in your module:
import yourmodule
for name in dir(yourmodule):
    attr = getattr(yourmodule, name)
    if callable(attr):
        lp.add_function(attr)
Alternatively, use pyinstrument (super minimal setup, amazing flamegraph output)
If you want total profiling with no decorators or changes, try pyinstrument:
# after installation with: `pip install pyinstrument`
# use it like this:

from pyinstrument import Profiler

profiler = Profiler()
profiler.start()

slow_function()

profiler.stop()
print(profiler.output_text(unicode=True, color=True))
Or run directly from the shell:
pyinstrument your_script.pyIt profiles everything, including nested calls and shows time spent in each function in a tree view. Great for exploratory profiling.
4. Memory Matters Too: Use memory_profiler
You already saw @profile for memory in the previous section. But here’s how to get even more visibility.
mprof run your_script.py
mprof plot
This gives you a memory usage timeline — like a stock price chart, but for your RAM. You’ll spot memory leaks, spikes, or unnecessary allocation in seconds.
5. Case Study: What Slows Down a Naive Loop?
Let’s say you’ve got this:
def naive():
    data = [x for x in range(10_000_000)]
    squares = [x * x for x in data]
    return sum(squares)
Now profile it:
cProfileshows you where time goes.line_profilershows[x * x for x in data]takes the bulk.memory_profilershows massive memory allocation for the two lists.
So you rewrite:
def optimized():
    return sum(x * x for x in range(10_000_000))
One generator expression. Same result. Less time. Less memory.
This is how real performance work looks: not random tweaks, but laser-focused edits based on real measurements.
6. Optional Power Tools: py-spy, scalene, viztracer
If you want serious firepower:
- py-spy — sample profiler you can run without modifying code. Great for profiling running processes.
- scalene — shows time and memory and CPU usage per line.
- viztracer — full trace viewer in your browser.
All excellent tools for bigger projects.
py-spy (for profiling also running processes)
pip install py-spy
# profile your_script.py:
py-spy top -- python your_script.py
# with a flame graph:
py-spy record -o profile.svg -- python your_script.py
Then open profile.svg in your browser.
Works even with running processes: py-spy top --pid 1234scalene (for CPU + memory + line time)
pip install scalene
scalene your_script.py
No code changes, and it outputs line-level profiling with:
- CPU time
- Memory allocation
- Copy activity
viztracer (tracer profiler, detailed call graphs)
pip install viztracer
viztracer your_script.py
This creates a .json trace file and automatically opens a Chrome-style trace viewer in your browser.
It traces everything: line timing, function calls, async, etc.
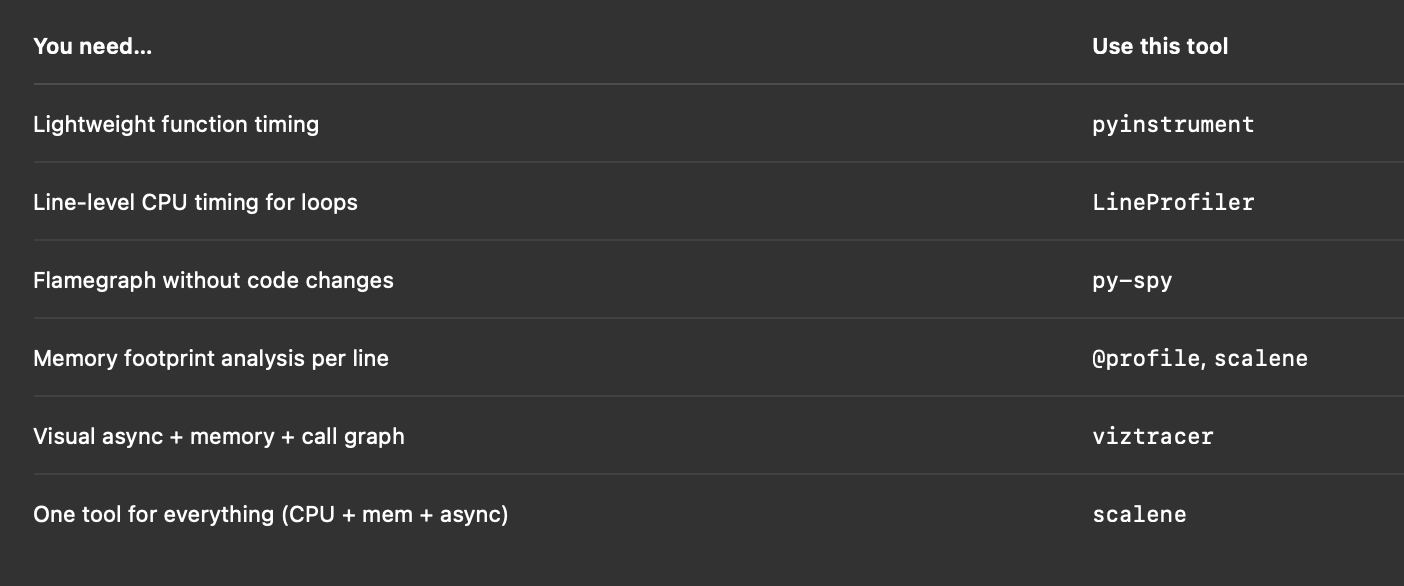
Profilers Summary
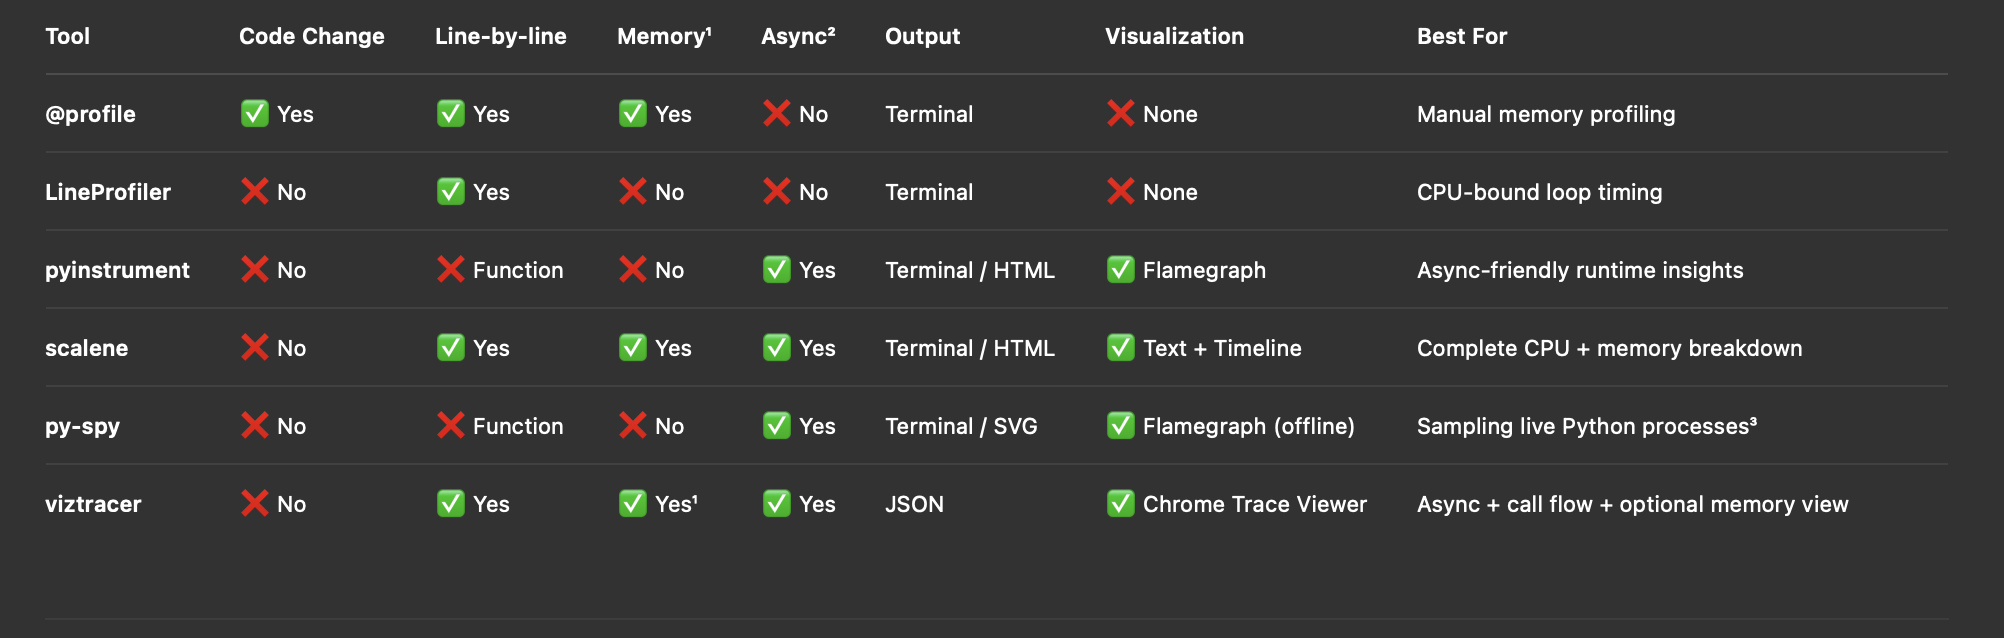
¹ Memory Support:
@profilefrommemory_profilertracks memory per line.scaleneandviztracerprovide memory usage with--log-memoryforviztracer.LineProfiler,pyinstrument, andpy-spydo not track memory.
² Async Support:
- Only
pyinstrument,scalene,viztracer, andpy-spyfully supportasync def,await, and event loops.
³ py-spy for production:
py-spyattaches to running processes (no code change), great for profiling live apps.Flamegraphsare offline.svgfiles, perfect for flame analysis.
Final Words: Loop Performance is a Process
Optimizing loops isn’t about rewriting everything to be “clever.” It’s about:
- Knowing when to parallelize
- Knowing when to stream instead of hoarding memory
- Knowing when to measure, not guess
In this article, I gave you tools and techniques to go from “this is slow” to “this is why it’s slow — and how to fix it.”
And now you can fix it, with confidence.
Do you like this kind of thinking?
- Follow me on Medium: @gwangjinkim for deep dives on Python, Lisp, system design, and developer thinking, and much more
- Subscribe on Substack: gwangjinkim.substack.com — coming soon with early essays, experiments & newsletters (just getting started).
- Visit my Ghost blog (here): everyhub.org — with hands-on tech tutorials and tools (most of them I cross-post here in medium, but not all of them).
Follow anywhere that fits your style — or all three if you want front-row seats to what’s coming next.